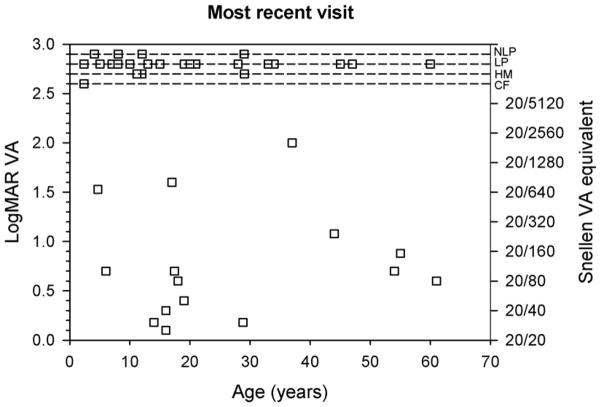
Figure 4.
LogMAR VA as a function age. VA measurements at the initial visit are shown in the top panel and data from the most recent visit are shown in the bottom panel. The Snellen equivalents of the logMAR values are shown on the right y-axes. The dashed lines, presented for clarity, indicate the four levels of non-measurable chart VA.

