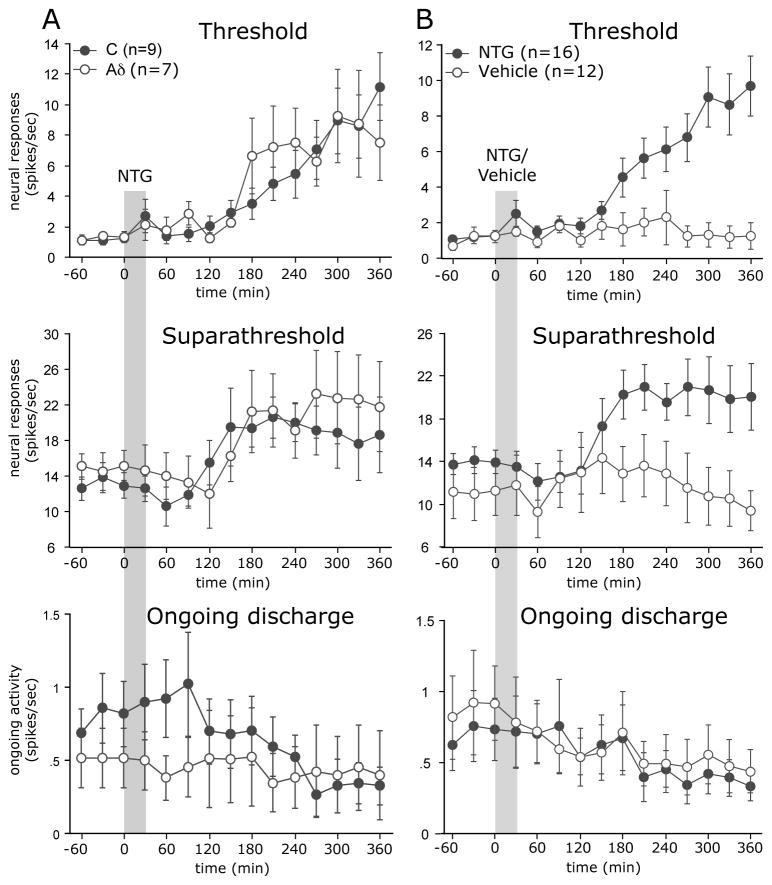
FIGURE 2.
(A) Time course changes in the average responses of Aδ and C-units meningeal nociceptors in response to NTG infusion. Note that in response to NTG infusion, the Aδ and C-units had a similar delayed increase in both threshold and suprathreshold responses, but did not exhibit an increase in their ongoing discharge rate. (B) Time course changes in the responses of meningeal nociceptors following infusion of the NTG vehicle (6 Aδ, 6 C-units) against a combined re-plotting of the Aδ and C-units responses to NTG from the same 16 neurons plotted in Fig 2A.

