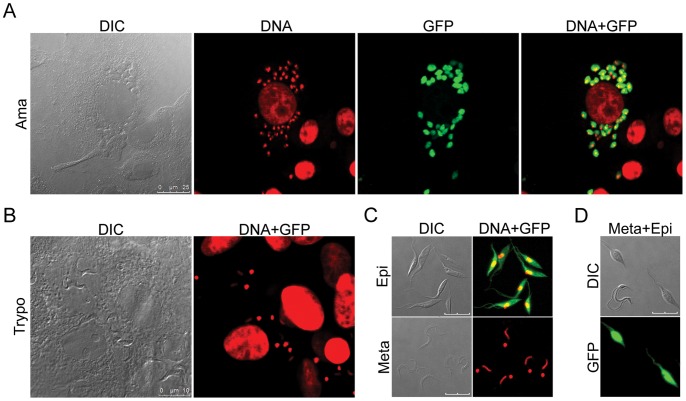
Figure 3. Fluorescence confocal microscopy assessing GFP expression in various stages of T. cruzi pBEX/GFP.
(A) Amastigote-infected Vero cells after 48 h of trypomastigote infection. (B) Trypomastigotes produced after 4 days of Vero cell infection. (C) Epimastigotes in the exponential growth phase (upper photos) and purified metacyclic forms (lower photos). (D) Mixture of live epimastigotes and metacyclic forms, showing the absence of GFP fluorescence in trypomastigotes. DIC: differential interference contrast; DNA: staining of DNA with Hoechst 33342 dye (for better visualization in overlay images, Hoechst fluorescence has been artificially converted to red); GFP: fluorescence of GFP; DNA+GFP: overlay images of Hoechst and GFP fluorescence. Bars correspond to 10 µm, except in A (25 µm).

