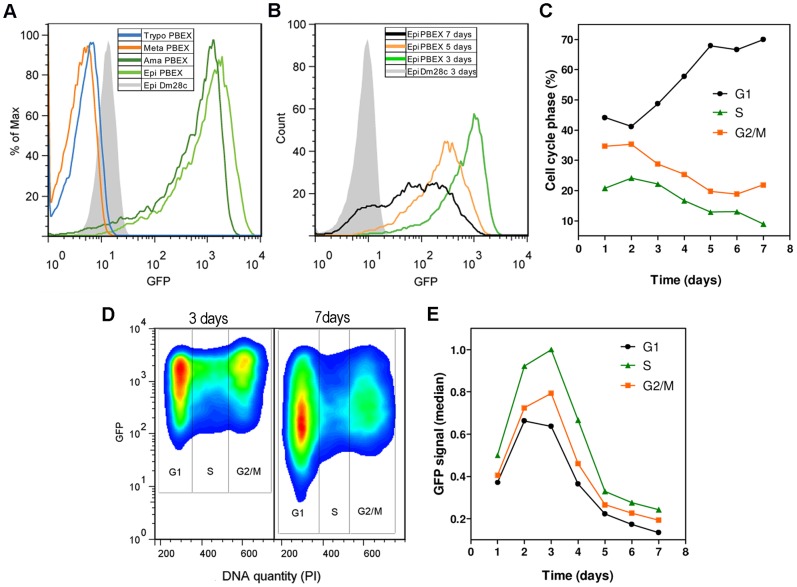
Figure 4. Flow cytometry analysis of GFP fluorescence in all major stages of the T. cruzi pBEX/GFP life cycle.
(A) Overlay histograms of GFP fluorescence in various forms of T. cruzi (specified in the box). Note that only the replicative forms (epimastigotes and amastigotes) of the parasite display GFP fluorescence. % of Max is a normalization of the total number of events in the overlaid histograms; each sample is scaled to the percentage of its maximum signal. (B) Overlay histograms of GFP fluorescence after various numbers of days of epimastigote culture; exponential growth phase (3 days), stationary phase (5 days) and late stationary phase with the presence of metacyclic forms (7 days). Cell culture was initiated with 1×10⁶ cells ml−1 (as in Figure 2A). (C) Percentage of epimastigotes in each phase of the cell cycle (G1, S and G2/M), as determined by flow cytometric analysis of DNA content with PI staining, during epimastigote culture. (D) Flow cytometry density plot showing the correlation of GFP fluorescence with the cell cycle of epimastigotes of T. cruzi pBEX/GFP after 3 days and 7 days of culture (indicated above the plot). (E) Median GFP fluorescence in each phase of the cell cycle during the culture of pBEX/GFP epimastigotes. The intensity of GFP expression is higher in cultures displaying active replication of DNA (S phase) and is highly dependent on culture time. In the plots, wild-type epimastigotes (Dm28c) were used as a negative control for the normalization of GFP fluorescence level. The results shown in (C), (D) and (E) are representative of duplicate experiments with coefficients of variation of less than 5%.

