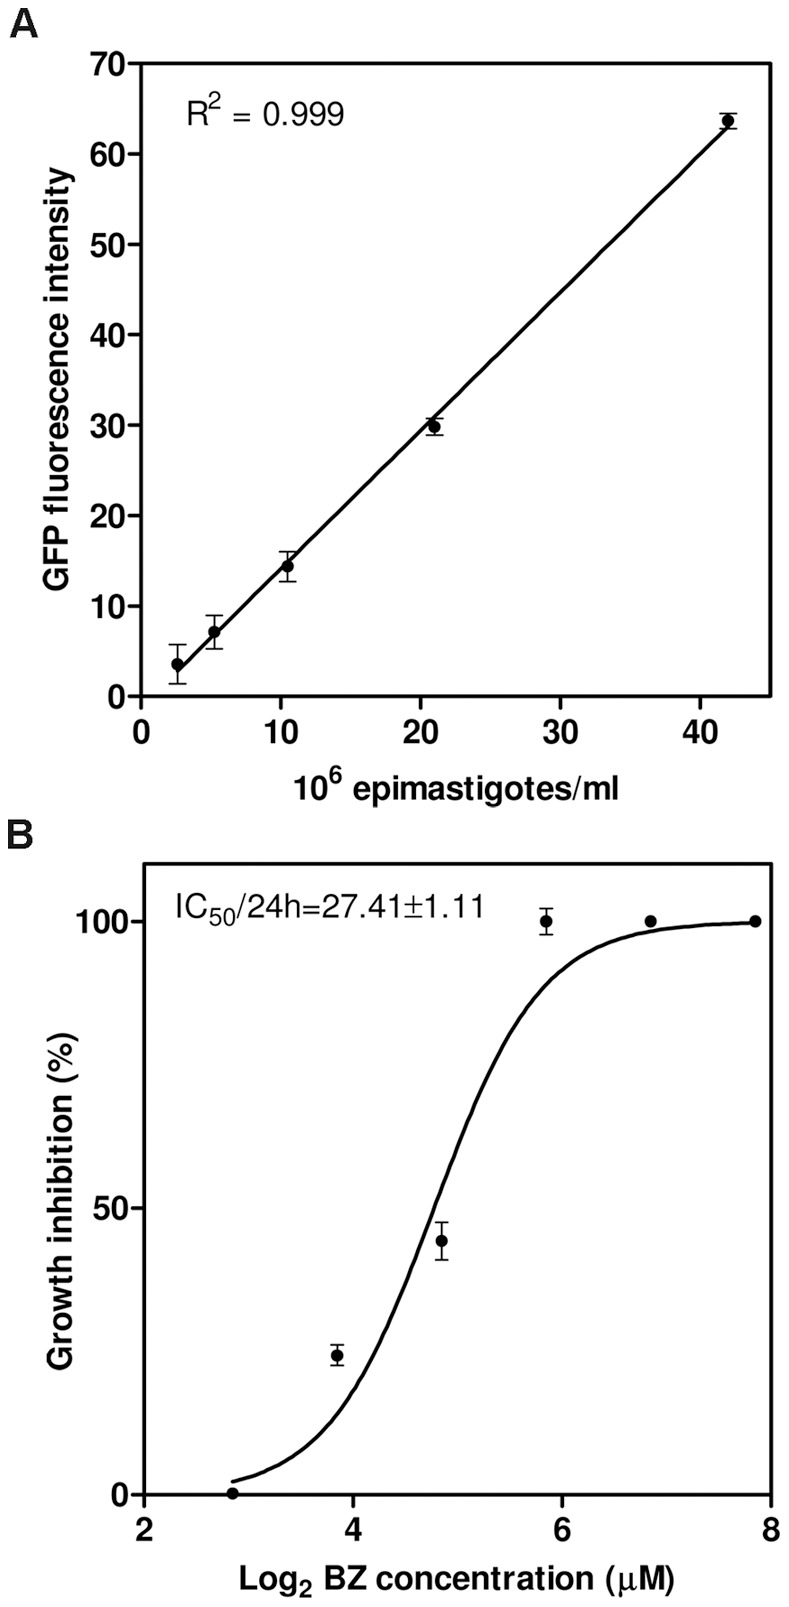
Figure 6. Fluorometric assay of parasite density.

(A) Correlation between cell density and the GFP fluorescence intensity obtained with a microplate reader. Epimastigotes were diluted to known densities in LIT medium in triplicate before fluorescence determinations; the total cell number and fluorescence intensity were strongly linearly correlated (R2 = 0.999). (B) Calculation of the benznidazole inhibitory dose by the microplate fluorometric method. Each experimental point represents the mean and standard deviation for quintuplicate drug exposures. The IC50/24 h is indicated on the graph.
