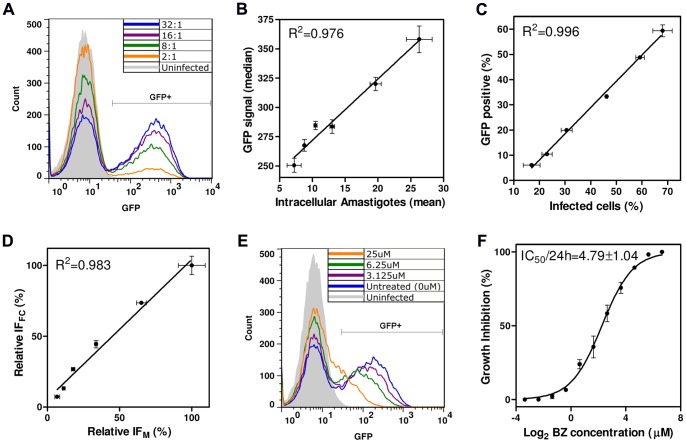
Figure 7. Flow cytometry assay for intracellular anti-amastigote activity.
(A) Overlaid histograms of GFP fluorescence in Vero cells infected with various ratios of trypomastigotes/Vero cells (indicated within the graph) together with a non infected control. The GFP+ Vero cells were considered to be infected with amastigotes. (B) Correlation between the mean number of amastigotes per Vero cell (obtained by manual counting on Giemsa-stained smears) and the median GFP signal of GFP+ Vero cells (obtained in flow cytometry experiments). Each experimental point corresponds to Vero infection with a different ratio of trypomastigotes/Vero cells (as in (A)). Note that the results of the two methods of intracellular amastigote quantification display a strong linear correlation (R2 = 0.976). (C) Correlation between the % infected cells obtained by microscopy and flow cytometry (R2 = 0.996). (D) Comparison of the infection indices in Vero cells obtained by microscopy (IFM) and flow cytometry (IFFC), to estimate intracellular amastigote growth. Data are shown as a percentage of maximum growth. The results of the two methods are highly correlated (R2 = 0.983). For details of IFM and IFFC calculation, see Materials and Methods. (E) Overlaid histograms of infected Vero cells (10 trypomastigotes/Vero cell) treated with different doses of benznidazole (indicated within the graph) together with uninfected and untreated controls. (F) Calculation of the benznidazole IC50/24 h (indicated within the graph) by the flow cytometry method. Each experimental point represents the mean and standard deviation of duplicate drug exposures.

