
Figure 1.
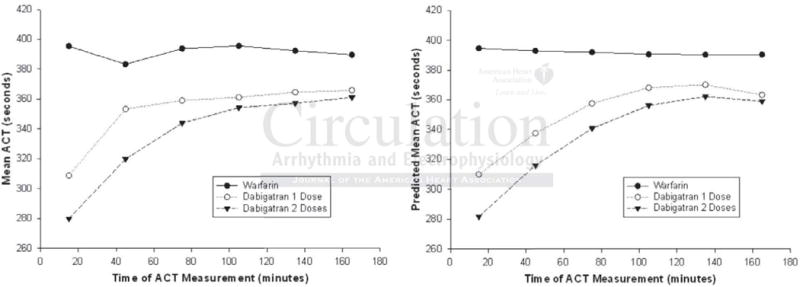
Mean intraprocedural ACT measurements throughout the PVI procedure. (Left) Mean ACT measurements across the time categorized by the 3 treatment groups. (Right) Growth curves generated from the random coefficient mixed model repeated measures analysis showing predicted mean ACT measurements across the time stratified by the 3 treatment groups.