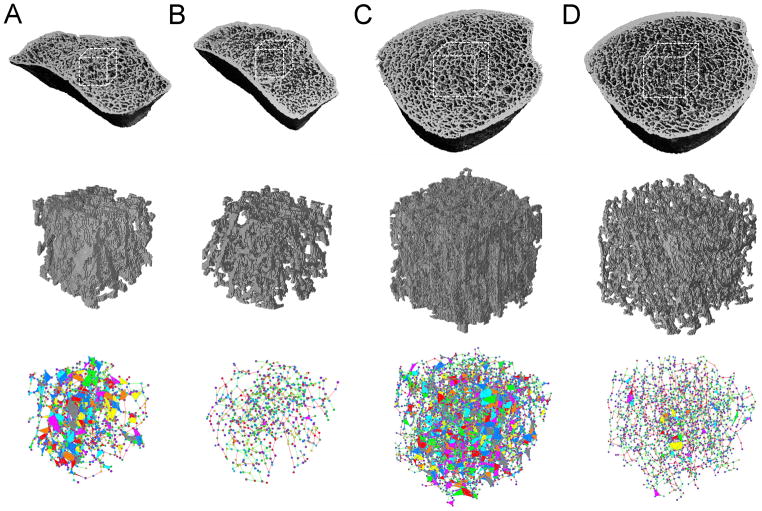
Figure 4.
(Top row) HR-pQCT images of distal radius of (A) the control group and (B) the fracture group, and distal tibia of (C) the control group and (D) the fracture group; (Middle row) HR-pQCT-based voxel models of central cubic sub-volumes (70×70×70 at distal radius and 110×110×110 at distal tibia) extracted from corresponding images; (Bottom row) HR-pQCT-based PR models of the corresponding cubic images.

