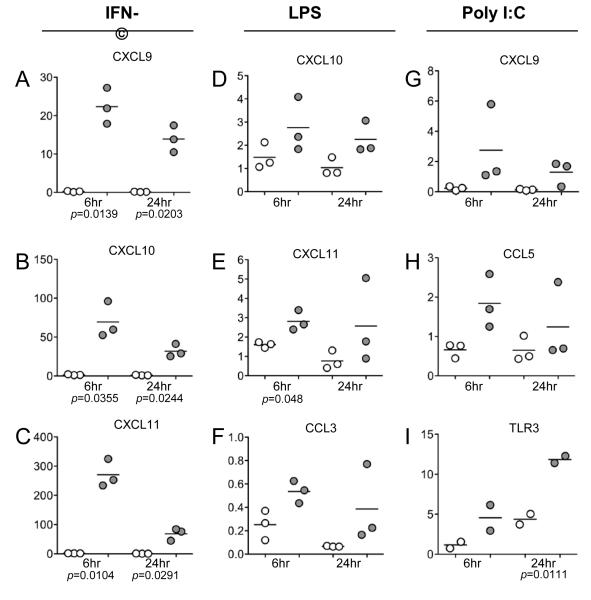
FIGURE 3.
Induction of chemokine and TLR3 mRNAs following stimulation of HiLN cells with IFN-γ, LPS or poly I:C. Using real-time RT-PCR, the relative mRNA levels of the indicated genes were detected in HiLN cells following exposure to IFN-γ, LPS or Poly I:C. In (A-C) are shown the induction of CXCR3 ligand mRNAs with IFN-γ at 6 and 24 hr post-stimulation. In (D-F) are shown the induction of CXCR3 and CCR5 ligand mRNAs with LPS at 6 and 24 hr post-stimulation. In (G-I) are shown the induction of CXCR3 and CCR5 ligand and TLR3 mRNAs with poly I:C at 6 and 24 hr post-stimulation. These data are combined analyses of HiLN cells from three different uninfected animals (only two for TLR3). Open symbols represent the untreated control cells and grey-filled symbols represented the paired treated cells. The mean values are shown superimposed upon the individual data points. Paired t-tests were used to compare the control from treated cultures and all p-values < 0.05 are provided.

