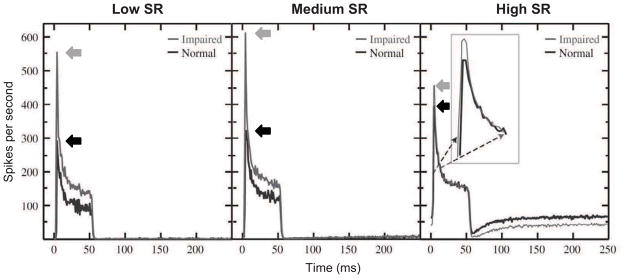
Fig. 3.

Post-stimulus time histograms of auditory-nerve fiber responses to 50-ms tones presented at characteristic frequency (CF). Fibers from chinchillas with noise-induced hearing loss show greater onset response amplitude (left-pointing arrows), reduced onset latency, faster adaptation during stimulation, and slower recovery following stimulus offset. Black and gray lines show mean responses of normal-hearing fibers and noise-exposed fibers, respectively, for populations of neurons with CFs between 1 and 4 kHz. Separate panels present data from fibers falling into different categories of spontaneous firing rate (SR): low (SR<1), medium (1<SR<18), and high (SR >18). Modified and reprinted from Scheidt et al. (2010), with permission from Elsevier.
