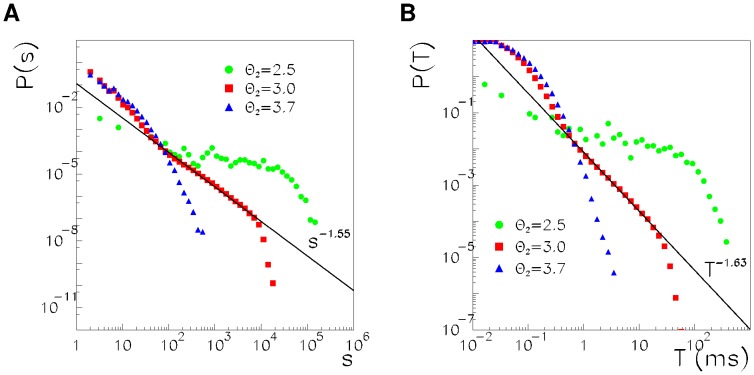
Figure 6. Avalanche size (A) and duration (B) distributions are shown for the network with 
 , and
, and  (circles), 3.0 (squares) and 3.7 (triangles).
Solid lines are power law best fits of the  data in the intervals
  for the sizes and 1 ms
  23 ms for the durations and give exponents
  for the sizes and
  for the durations.

