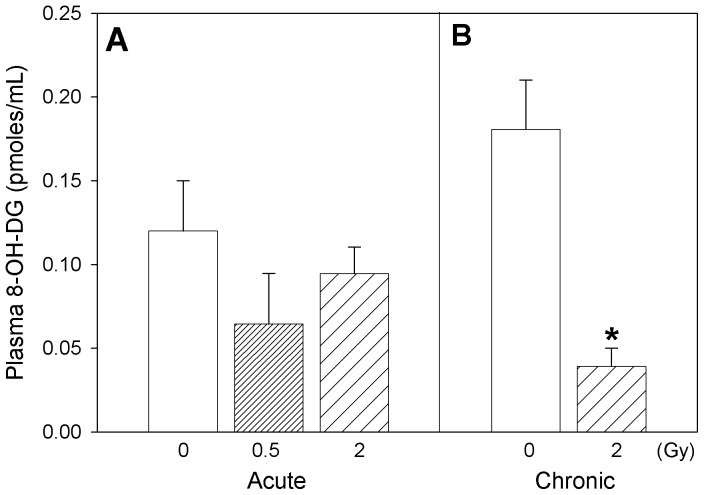
Figure 2. Marker of DNA oxidation.
Plasma levels of 8-hydroxy-deoxyguanosine in Apo-E−/− mice following (A) acute (B) chronic radiation exposure. Mean ± SEM. Acute, 0 (n = 3), 0.5 Gy (n = 8), 2 Gy (n = 4). Chronic, 0 (n = 4), 2 Gy (n = 4). Two-way ANOVA with Dose (0, 2 Gy) and Time (acute, chronic) as factors. Dose x Time interaction, p = 0.047. * Tukey test, Dose within chronic, 0 vs 2 Gy, p<0.05.

