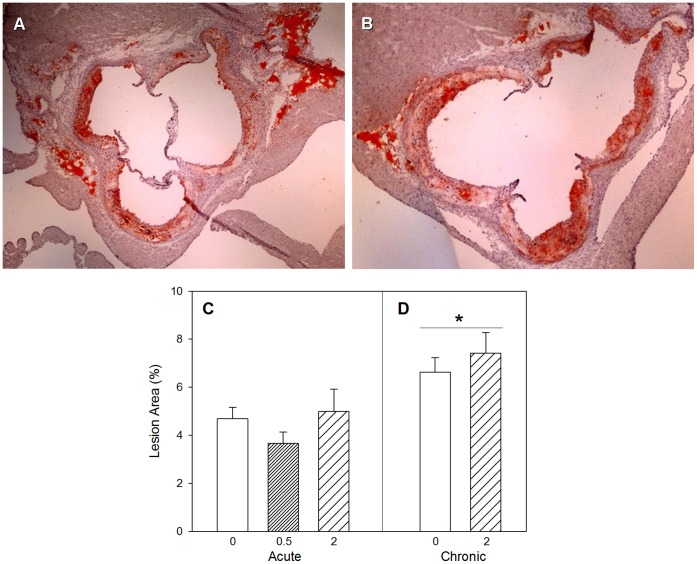
Figure 8. Atherosclerosis plaques.
Sections of the orifices of the coronary arteries marking the start of the ascending arch in a 5-month old control ApoE−/− mouse (A) and an ApoE−/− mouse following chronic radiation exposure (B). Percent lesion area profiles for acute (C) and chronic (D) radiation exposure. Mean ± SEM. Acute, 0 (n = 15), 0.5 Gy (n = 15), 2 Gy (n = 15). Chronic, 0 (n = 15), 2 Gy (n = 15). Two-way ANOVA with Dose (0, 2 Gy) and Time (acute, chronic) as factors, Time main effect, p = 0.005. *Tukey test, acute vs chronic, p<0.05.

