
Figure 3. Illustrative Example of Recurrence Force Profiles for (a) Chat, (b) Approach and (c) Contact Phases.
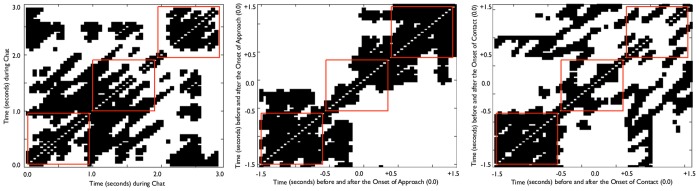
Note: The Recurrence Force Profiles show the sum of individual recurrence points (using the measure of %RECurrence). The more saturated parts of the plots show a higher density of recurrence points (i.e., the small black dots). Areas of higher density indicate greater sameness of posture (which could either be continuing stillness or continuing small scale movements). Areas of low saturation show little recurrence and could either indicate irregular movements or large scale movements. In Figures (b) and (c), 0.0 on the axes marks the approximate point of Onset of Approach or Onset of Contact (because each dot in the plot consists of several data points in the time series, the absolute point of Onset cannot be precisely located). The three red squares in each figure highlight the three 1 second time segments of analysis in each plot.