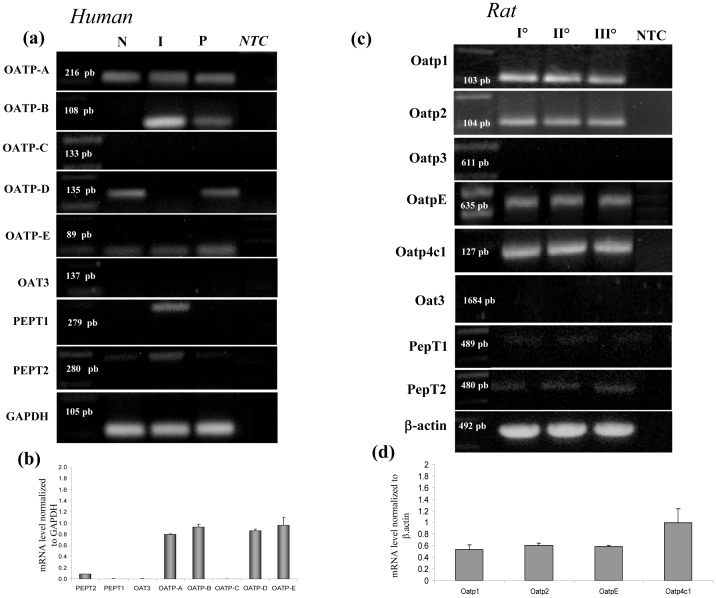
Figure 6. Transporter gene expression in human and rat podocytes.
Results from RT-PCR and QRT-PCR analysis of membrane transporters in human cell lines (a,b) and primary rat podocytes (c,d). (a) RT-PCR analysis of human cells lines; P = human podocytes, N SHSY-5Y = neuroblastoma cells; I Caco2 = colon cancer cells. (b) QRT-PCR analysis of membrane transporters using the same primers in human podocytes. (c) RT-PCR analysis of primary rat podocytes; the results compare gene expression of cells obtained from three distinct isolation procedures (I, II, III). (d) QRT-PCR analysis of Oatps members in primary rat podocytes. Results are expressed as mean ± SEM of three independent experiments. NTC = RT-PCR negative control.

