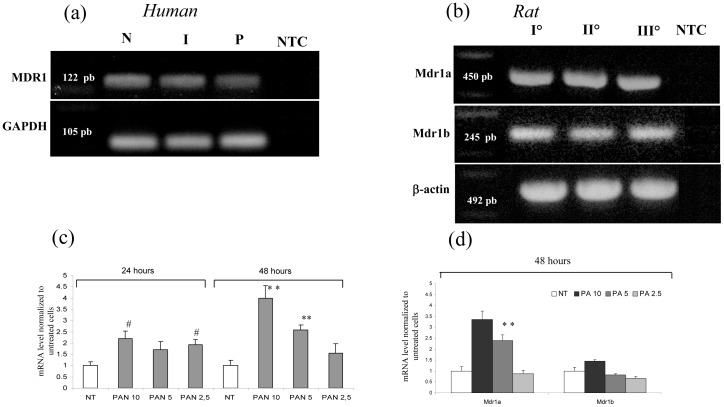
Figure 8. Gene expression analysis of P-glycoprotein in human and rat podocytes.
(a) PCR analysis of MDR1 in human podocytes. (b) PCR analysis of Mdr1a and Mdr1b in rat podocytes. NTC = RT-PCR negative control. Panel (c) shows the increase of MDR1 after 24 and 48 hours of PA incubation in human podocytes, and panel (d) displays the variation in Mdr1a and Mdr1b expression in rat podocytes. Results are expressed as mean ± SEM of three independent experiments. # P<0.05 * * P<0.001.

