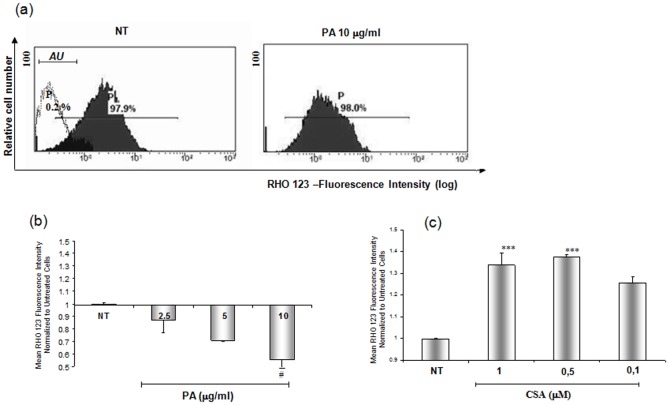
Figure 10. P-glycoprotein activity.
Panel (a) shows representative histograms of Rho 123 fluorescence variation in the human podocyte cell line after PA (10 ug/ml) or cyclosporine A (CSA) (1 uM) treatment for 48 hours or incubation with medium alone (NT). The white area in the right upper panel corresponds to the autofluorescence region (AU). The values (P) in the figure indicate the percentage of fluorescent cells. Panels b) and c) illustrate PA and CSA effects on Rho 123 exit from the cells. Results are expressed as mean ± SD of three independent experiments. # P<0.05 vs NT, *** P<0.0001 vs.NT.

