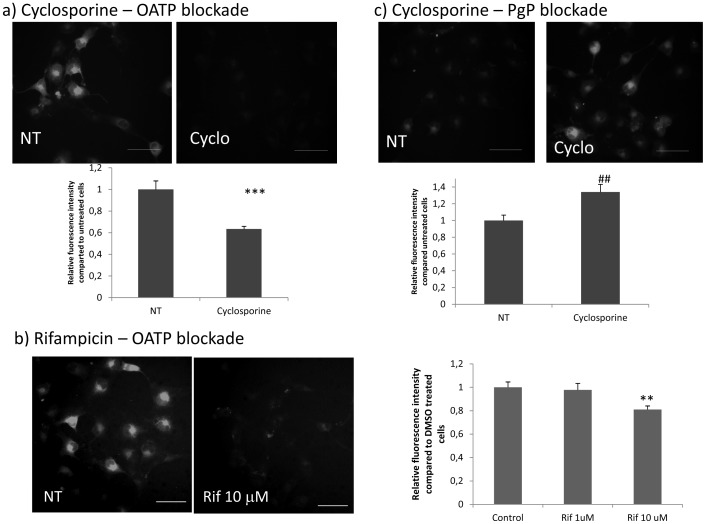
Figure 11. OATPs and P-glycoprotein blockade.
a) Inhibition of OATPs by cyclosporine. Incubation of cells with vehicle (30 min), followed by fluorescent penicillin (30 min) (NT) results in a diffuse cytoplasm fluorescent signal indicating that penicillin has entered the cell (left panel). If cyclosporine (CYCLO) is added before penicillin (right panel), most cells are negative, indicating the blockade of influx transporters (*** P<0.0001 vs NT). b) Inhibition of OATPs by rifampicin. The left image represents an example of control cells incubated with vehicle followed by penicillin, showing entrance of the antibiotic as witnessed by fluorescent cytoplasm signal. On the right, 10 uM rifampicin is able to inhibit the entry of penicillin, and cells do not contain fluorescent material (** P<0.001). c) P-glycoprotein blockade by cyclosporine. The left image shows representative cells incubated with fluorescent penicillin for 30 min, followed by vehicle for additional 30 min. At this time point, penicillin has almost completely left the cells, which are mostly negative by immunofluorescence. On the right, the image shows cells incubated with fluorescent penicillin for 30 min, followed by cyclosporine for additional 30 min. Retention of fluorescence indicates the blockade of efflux transporters by cyclosporine (## P<0.005). Graphs show the results of digital measurement of fluorescent intensity, obtained from three different experiments and on 100 cells/experiment. Results are expressed as mean ± SEM. Bar = 50 um.

