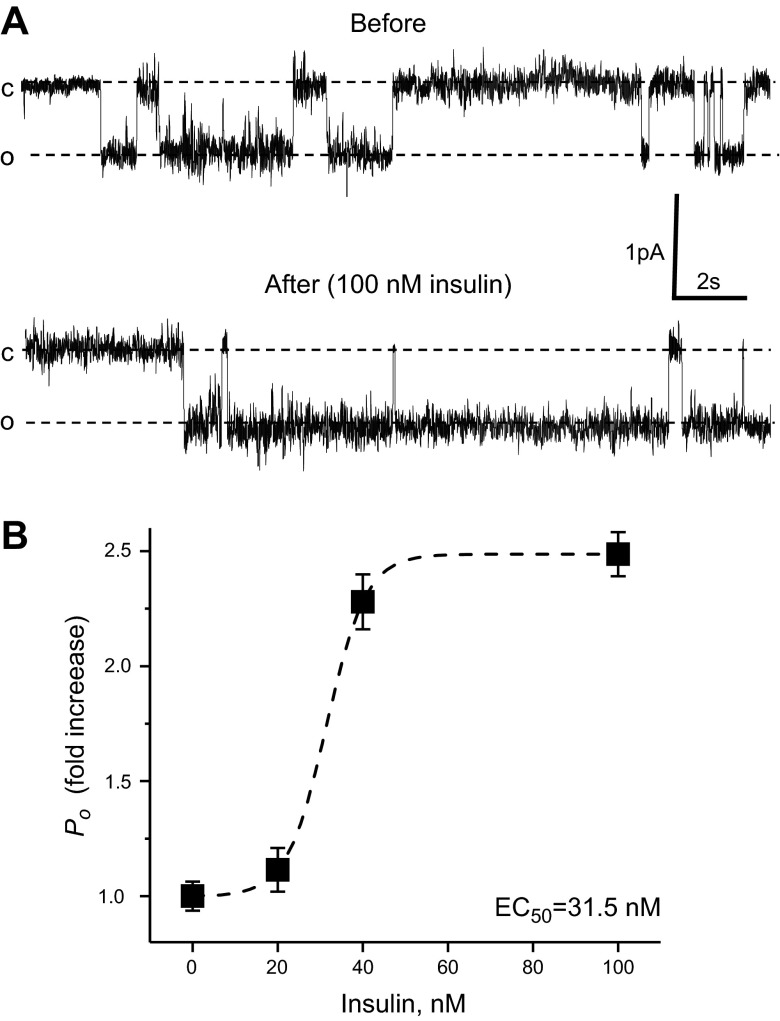
Figure 1.
Insulin increases ENaC Po in freshly isolated split-open CCDs of WT (C57BL/6J) mice fed a sodium-deficient diet for 1 wk. A) Representative current traces from a cell-attached patch in the control and after application of 100 nM insulin. B) Summary graph of ENaC Po changes in response to application of 0, 20, 40, and 100 nM insulin. For each individual experiment, the changes were normalized to ENaC Po in the control; fold increase is shown. Dashed lines are the best fit of the Hill equation. N varies from 5 to 14 experiments for each insulin concentration.

