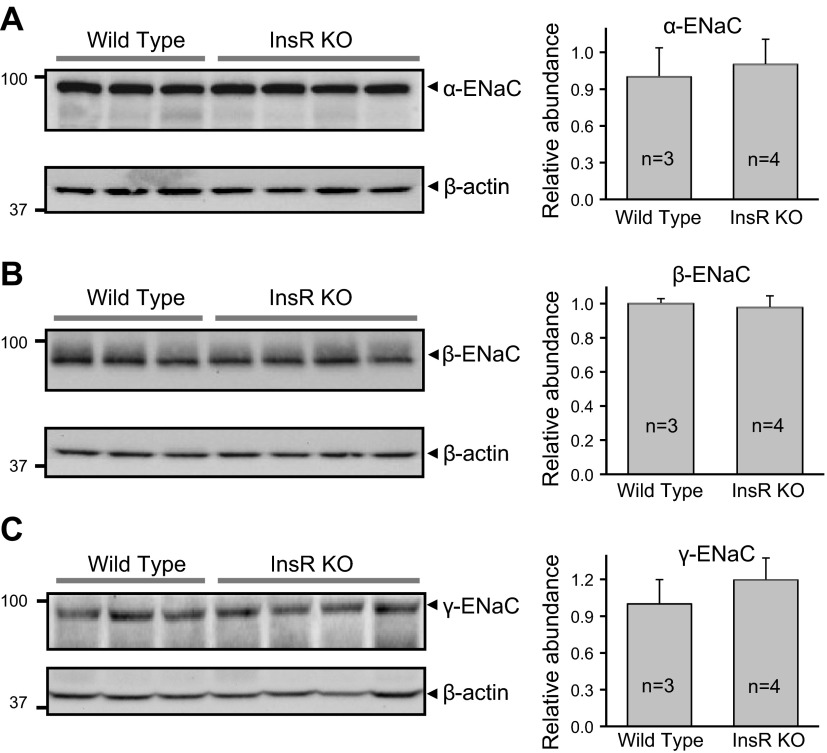
Figure 4.
KO of InsR does not affect expression profiles of ENaC subunits in the kidney cortex. Western blot analysis of α-ENaC (A), β-ENaC (B), and γ-ENaC (C) subunit expression in mouse kidney cortex. Cell lysates were collected from InsR-KO mice and their WT littermates and analyzed using anti-ENaC antibodies; equal loading was verified by anti-β-actin antibodies. Summary graphs (right panels) represent densitometric analysis of relative ENaC subunit abundance.

