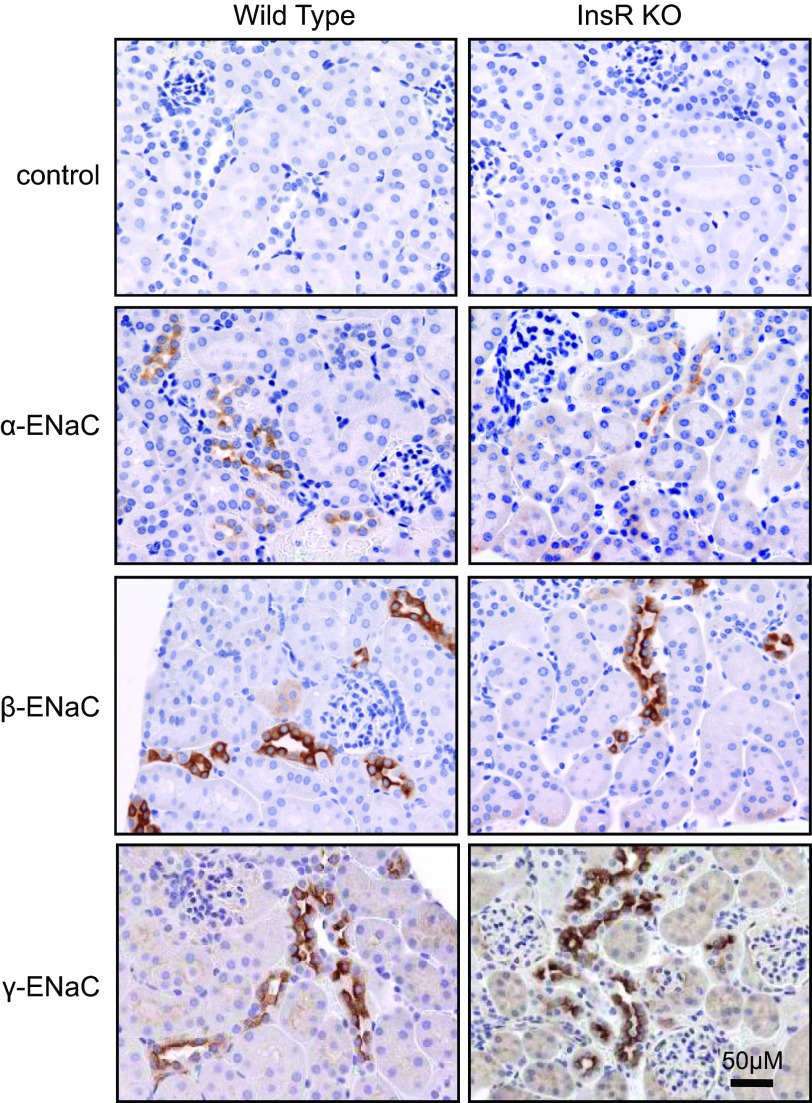
Figure 5.
Expression and localization of ENaC subunits in the kidney from the InsR-KO mice and their WT littermates. Representative immunohistochemical staining for ENaC subunits in the kidney cortical sections of InsR-KO mice and their WT littermates at ×40 view. Top panels show negative control tissue stained with secondary antibodies in the absence of primary antibodies. Scale bar = 50 μm. Note the edges of the kidney and glomeruli, confirming the cortex localization.

