Figure 6.
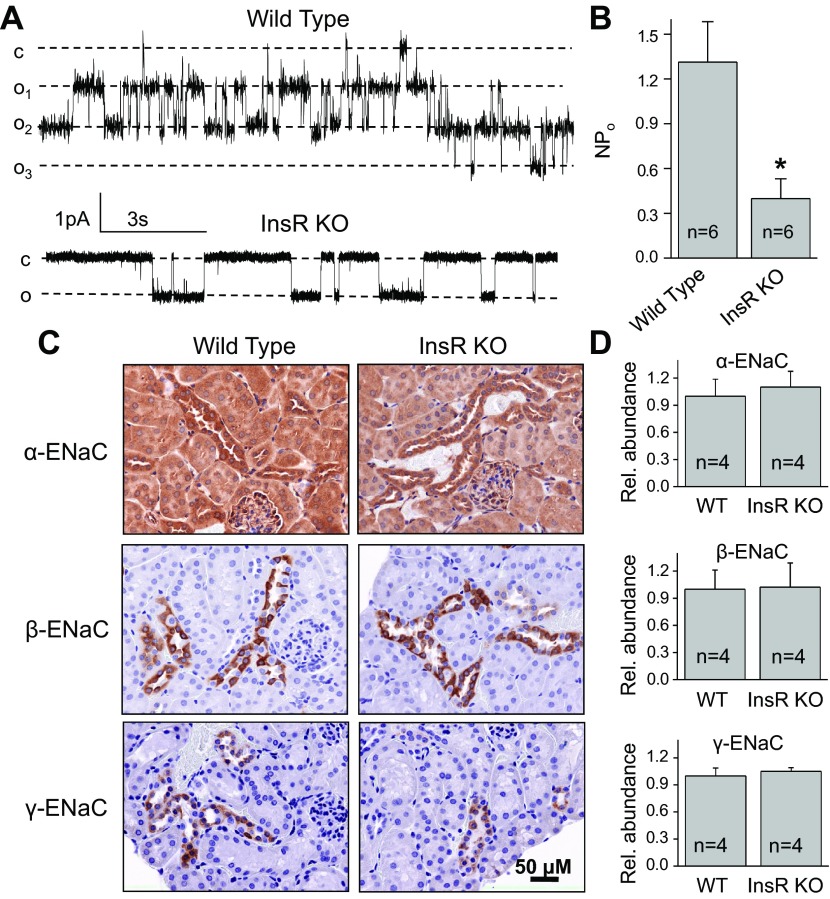
ENaC activity and expression in CCDs isolated from InsR-KO mice fed a normal-salt (0.49%) diet. A, B) Representative current traces (A) and summary graphs of ENaC NPo (B) from cell-attached patches containing ENaC and recorded from the apical membrane of split-open CCD cells of WT and InsR-KO mice fed normal-Na+ diet. Holding potential is −60 mV. *P < 0.05 vs. WT littermates. C) Representative immunohistochemical staining for ENaC subunits in the kidney cortical sections of InsR-KO and their WT littermate mice at ×40 view. Scale bar = 50 μm. D) Summary graphs of Western blot analysis of α-ENaC, β-ENaC, and γ-ENaC subunit expression in mouse kidney cortex. Cell lysates were collected from InsR-KO mice and their WT littermates and analyzed using anti-ENaC antibodies; equal loading was verified by anti-β-actin antibodies.

