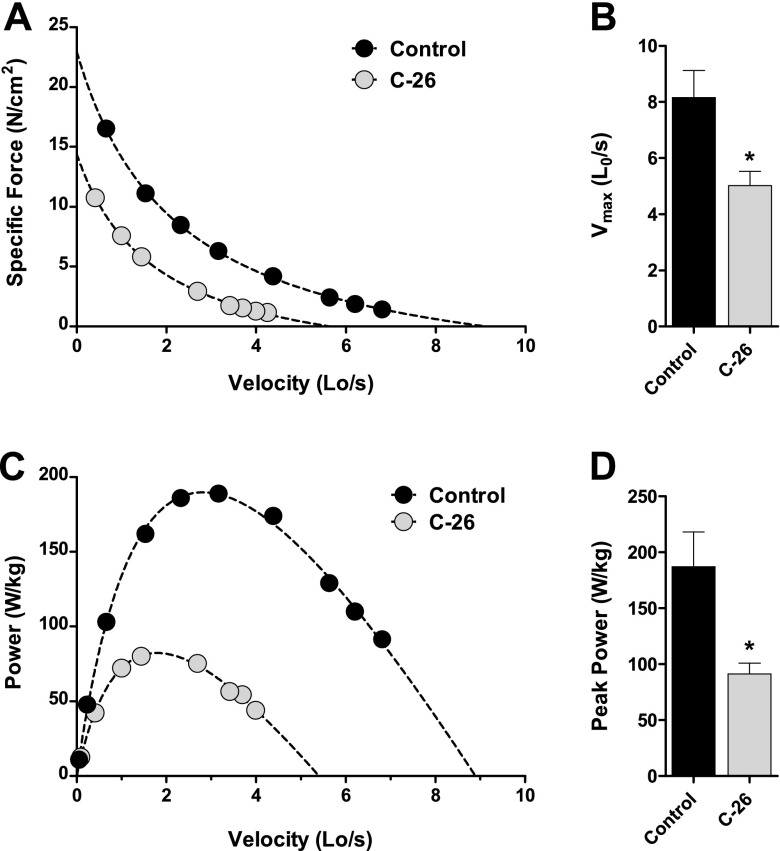
Figure 4.
Diaphragm isotonic contractile properties in control and C-26 tumor-bearing mice. A) Relationship between specific force and shortening velocity from a representative control and C-26 mouse. B) Power-velocity relationship calculated from data shown in A. C) Maximal shortening velocity determined from each individual force-velocity relationships. D) Peak power determined from each individual power-velocity relationship. Bars represent means ± se for 5–6 mice/group. *P < 0.05 vs. control.

