
Figure 2.
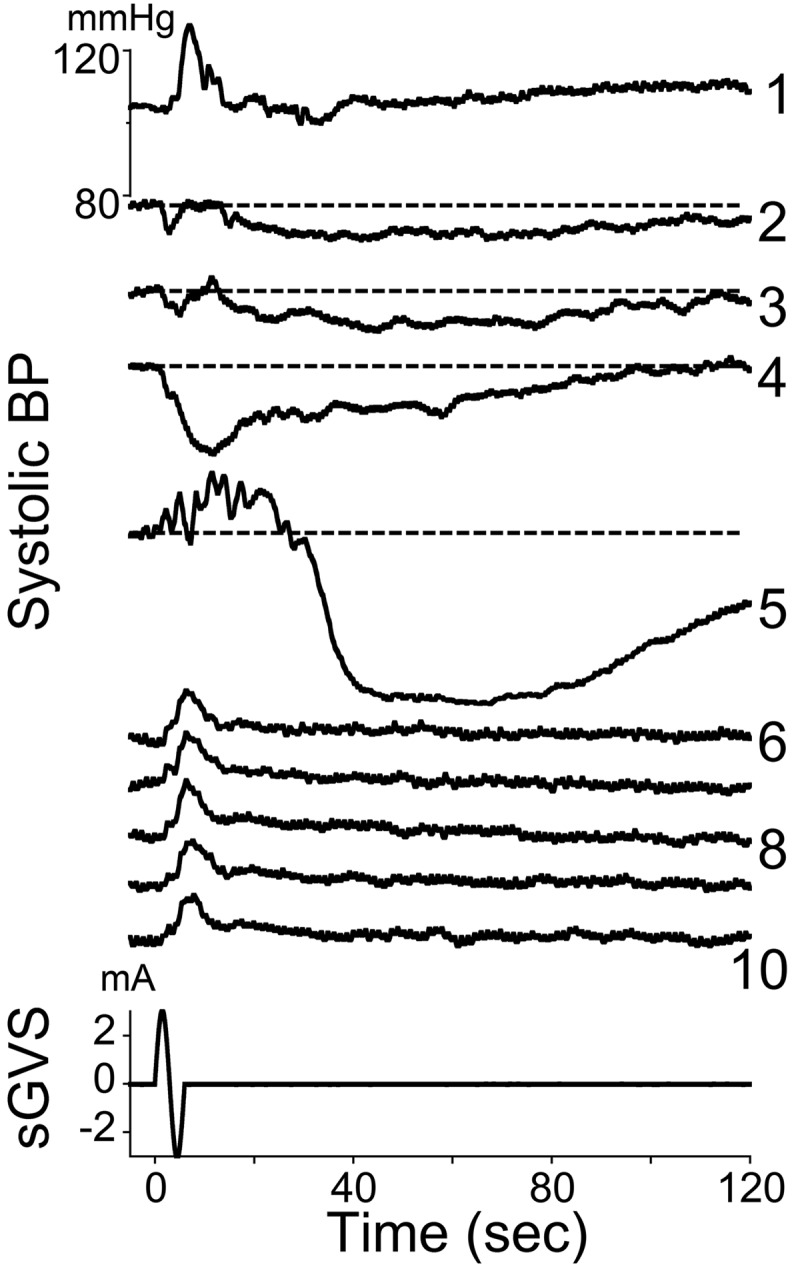
Changes in systolic BP in response to 10 sine waves of 3 mA at 0.05 Hz. Consecutive responses are labeled with numbers on the right. Horizontal dashed lines in responses 2–5 are BP levels at the onset of each stimulus. The fifth sinusoid induced a brief increase in BP with superimposed large oscillations. This was followed by a profound decrease in BP that gradually recovered over several minutes. Subsequent stimulations over the next 25 min only induced increases in BP at a fixed latency, and there were no further drops in BP associated with these increases. Bottom traces: sGVS stimulus (mA) and time (s).