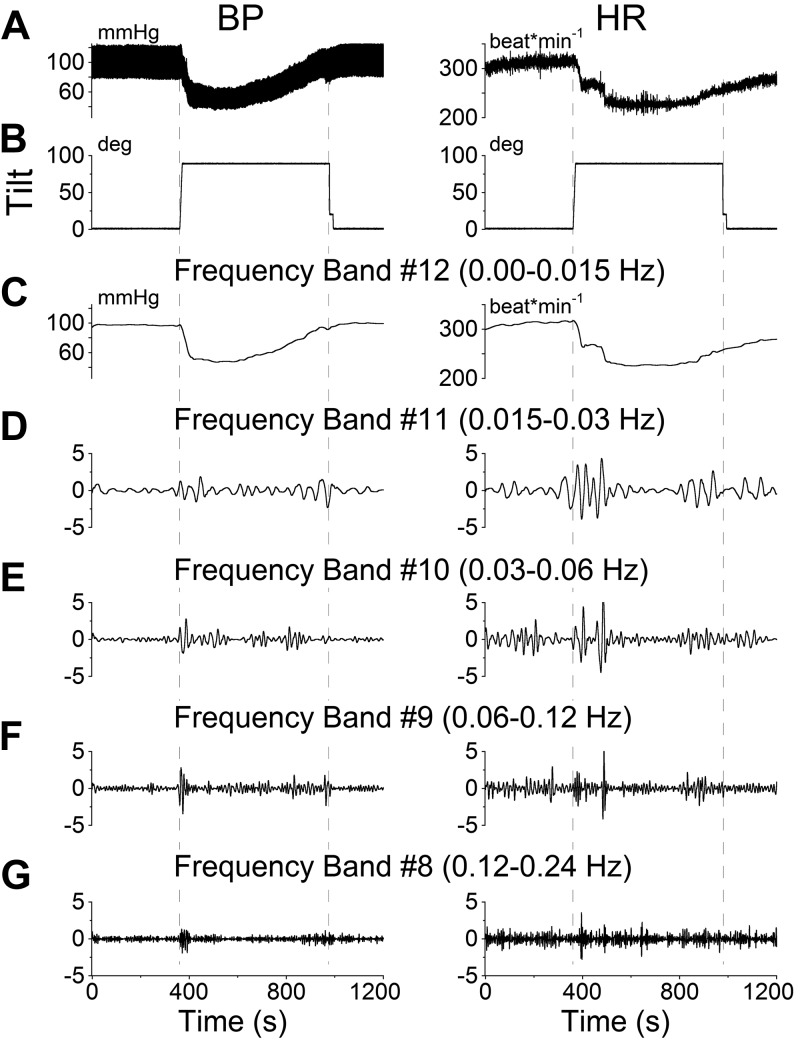
Figure 4.
Wavelet analyses of the VVR induced in rat R644 by 90° nose-up tilt. A) Traces of BP (left panel) and HR (right panel). B) Tilt angle. C–G) Wavelet decomposition of the data from A into 5 frequency bands that comprise the transient response, which includes all low frequencies (band 12 and higher), labeled band 12 for simplicity (C), and the Mayer wave range: band 11 (D), band 10 (E), band 9 (F), and band 8 (G). Left panels: BP. Right panels: HR.

