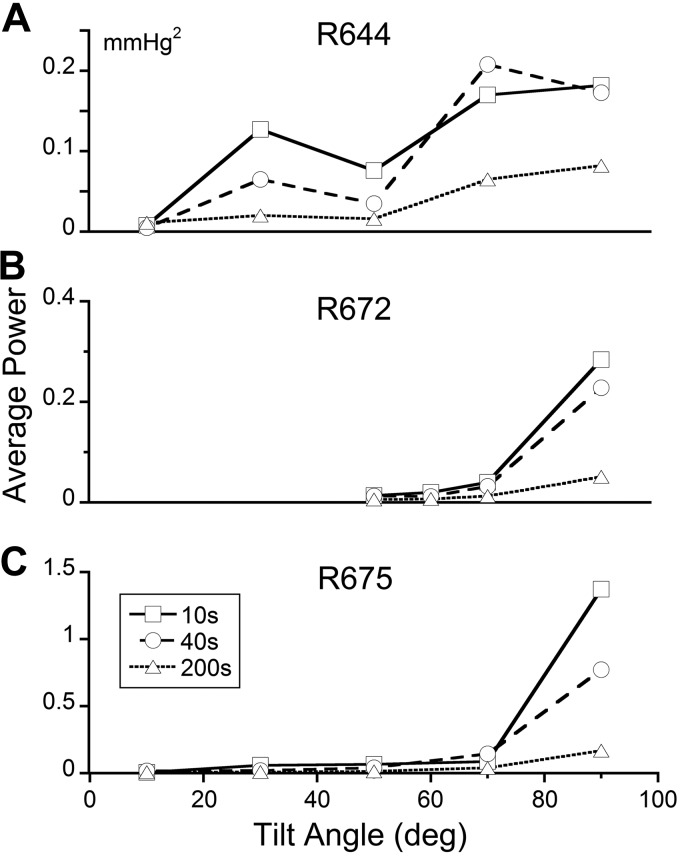
Figure 6.
Average power for the signal representing the summation of four detail bands ranging in frequencies associated with Mayer waves of BP after onset of tilt for animals R664 (A), R668 (B), and R672 (C). This was done by summating 4 detail bands with frequencies just above the approximation signal (transient response), comprising frequency bands 11, 10, 9, and 8, with corresponding frequency ranges of 0.015–0.03, 0.03–0.06, 0.06–0.12, and 0.12–0.24 Hz, respectively. Average power was computed over 10 s (squares), 40 s (circles), and 200 s (triangles) s. In all 3 rats, the maximum average power occurred when the averaging was 10 s (shortest time) and for tilts >70°. In all instances, the blood pressure was estimated from the PPG.

