
Figure 1. Illustration of Proteus phenemonen from Ioannidis and Trikalinos [27].
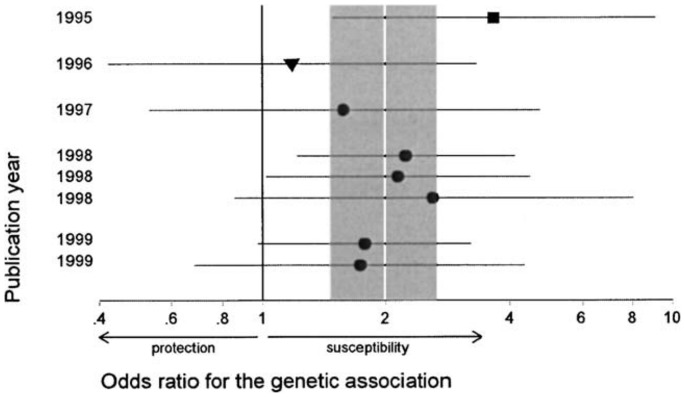
(Reprinted from Journal of Clinical Epidemiology, Vol. 58, J. P. Ioannidis and T. A. Trikalinos, Early extreme contradictory estimates may appear in published research: The Proteus phenomenon in molecular genetics research and randomized trials, pp. 543–549, 2005, with permission from Elsevier.) The figure shows odds ratios and 95% confidence intervals of “the relationship between the methylenetetrahydrofolate reductase (MTHFR) TT genotype in the mother and the risk of neural tube defects in the child”. The study with the strongest effect is shown by a square symbol and the study with the smallest effect is shown by a triangular symbol. The white line represents the summary odds ratio. The shaded area represents the 95% confidence interval of the summary odds ratio.