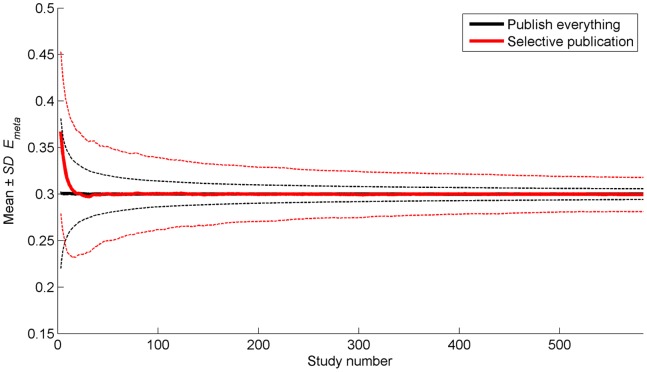
Figure 4. Mean (thicker solid lines) and mean plus/minus one standard deviation (thinner dashed lines) of the cumulative meta-analytic effect as a function of the number of studies.
Note that the number of studies can vary per repetition because the simulation was terminated when 40 publications were done under the Selective Publication Approach. Only studies having more than 4,500 out of 5,000 Emeta values available are shown (i.e., study numbers 3–585). The means and standard deviations are calculated across the repetitions of the simulation.

