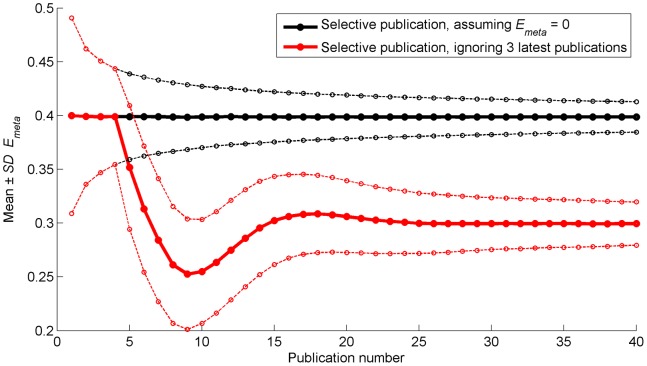
Figure 6. Mean (thicker solid lines) and mean plus/minus one standard deviation (thinner dashed lines) of cumulative meta-analytic effect as a function of the number of publications.
The black lines represent the situation where Eobs is tested with respect to 0. The red lines represent the situation when ignoring the 3 latest publications for determining Emeta. The means and standard deviations are calculated across the 5,000 repetitions of the simulation.

