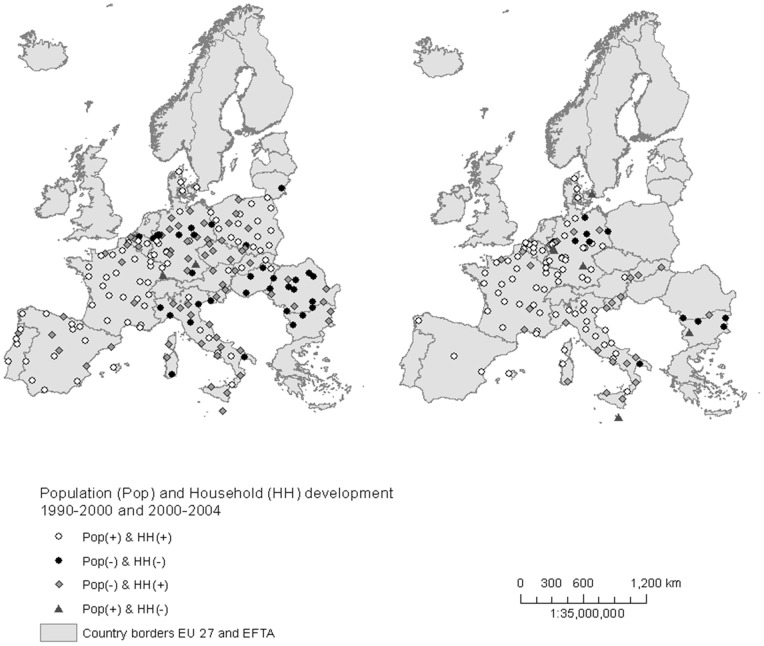
Figure 2. Distribution of cities in Europe according to population and household development in 1990–2000 and 2000–2004.
POP – Population, HH – Households,+positive growth rate, −negative growth rate. Note: No data on household number was available for the period 2000–2004 for Poland, the Czech Republic, Romania, Switzerland, Hungary, Lithuania and Portugal.

