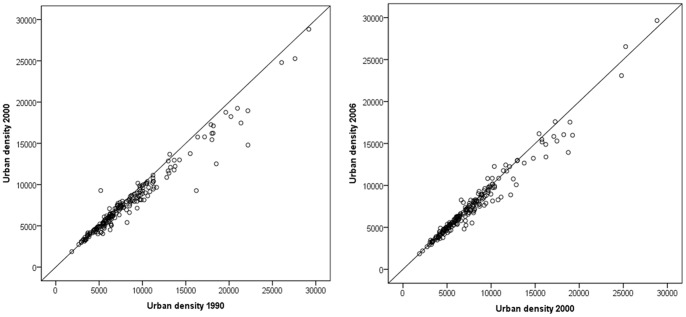
Figure 3. Population densities of European cities represented for 1990 compared to 2000 and for 2000 compared to 2004.
Cities on the right side of the dividing line show a decline in density values compare to the other point in time. Note: Population density is shown as built-up density which is the population number per km2 urban area.

