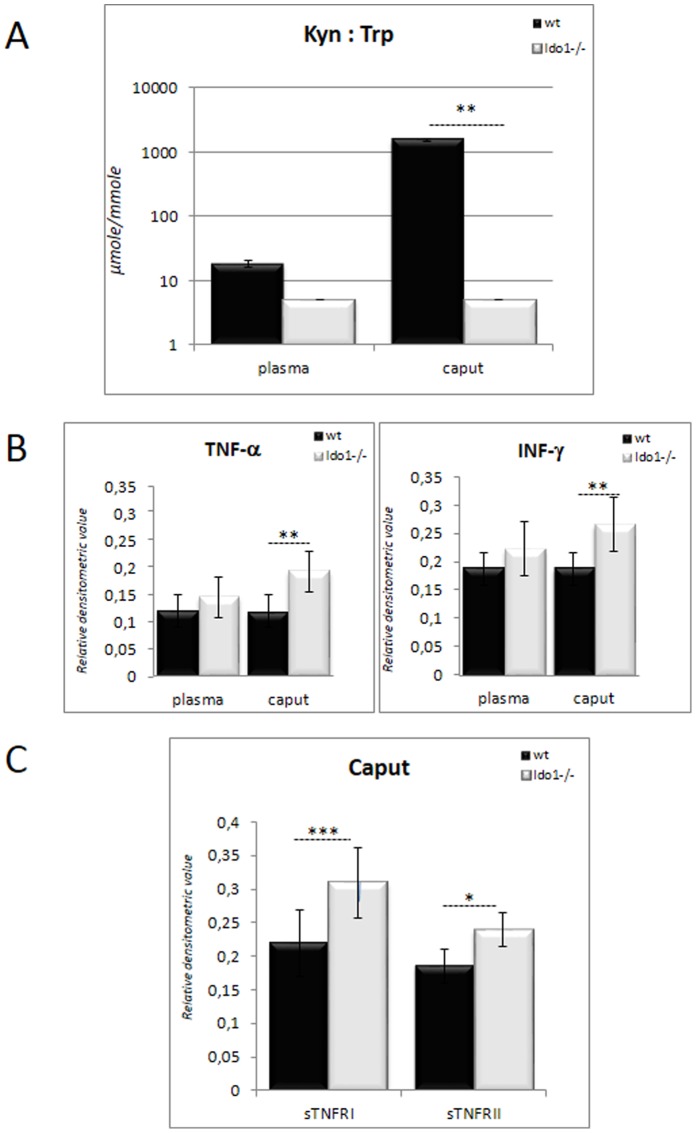
Figure 1. Analysis of the inflammatory status of the epididymis.
A: KYN:TRP ratios in caput epididymis and blood plasma, respectively, of 6 month-old wt and IDO1−/− animals. The Y-axis is a semi logarithmic representation in µmole/mmole. B: Histograms show the levels of INF-γ and TNF-α in caput epididymidis extracts and plasma from 6 month-old wt and IDO1−/− animals. C: Histogram shows the levels of the soluble TNF receptors (sTnfRI and sTnfRII) in caput epididymidis extracts from 6 month-old wt and IDO1−/− animals. *P≤0.05, **P≤0.01, ***P≤0.001.

