
Figure 8. Monitoring of the activation of the TGFß/BMP pathway in caput epididymis extracts.
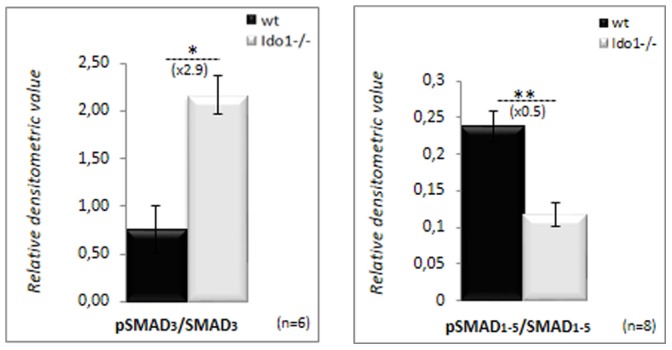
Bar graphs showing the levels of Smad3 and Smad1-5 proteins and their phosphorylated counterparts phosphoSmad3 and phosphoSmad1-5 upon activation in caput epididymidis extracts from wt and IDO1−/− mice at 6 months of age. Bar graphs display means ± SEM using GAPDH as an internal standard for quantification (n = 4 for Smad3, and n = 8 for Smad1-5; *P≤0.05; **p<0.01).