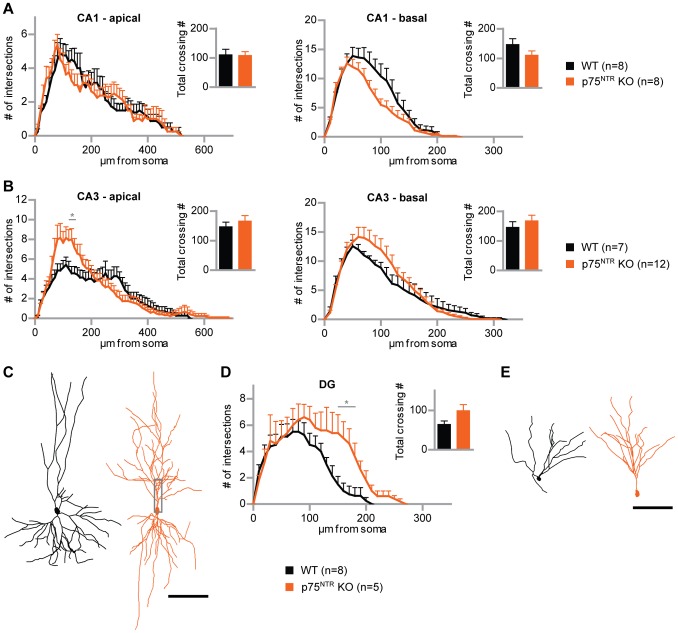
Figure 6. p75NTR-deficient type A ESNs are more complex than the WT.
(A) Sholl analysis of p75NTR-deficient pyramidal-like ESNs (orange) compared to WT ESNs (black) in the CA1 region, for apical and basal dendrites, respectively. (B) Sholl analysis of p75NTR-knockout ESNs versus WT ESNs in CA3. (C) Tracing examples of WT and p75NTR-knockout ESNs in CA3. (D) Sholl analysis of granule cell-like ESNs in the DG, p75NTR-deficient and WT, respectively. P75NTR-knockout ESN dendritic trees are longer and significantly more complex. (E) Tracing examples of granule cell-like ESNs in the DG, WT versus p75NTR-knockout. Student’s t test, *p<0.05; error bars represent SEM. Scale bars 100 µm.

