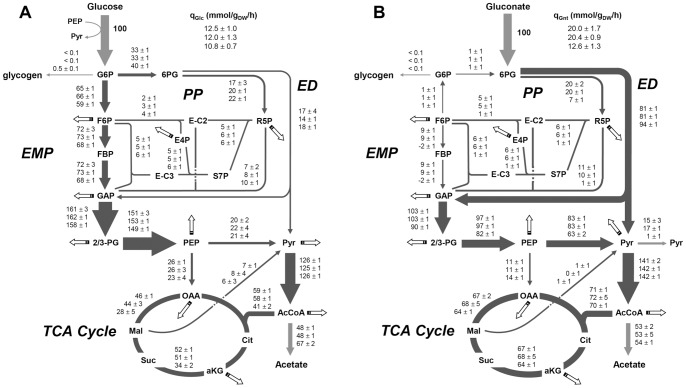
Figure 3. Metabolic flux distributions upon growth on glucose (A) and gluconate (B) as carbon source.
Values from top to bottom: wild-type strain, ΔcsrBC and ΔcsrA51. Flux values are normalized to the specific glucose uptake rate of each strain, which was arbitrarily given the value of 100. Values represent the mean ± standard deviation of three independent biological replicates for each strain. Arrow thicknesses represent the flux values in the wild-type strain. Box arrows represent fluxes towards biomass synthesis.

