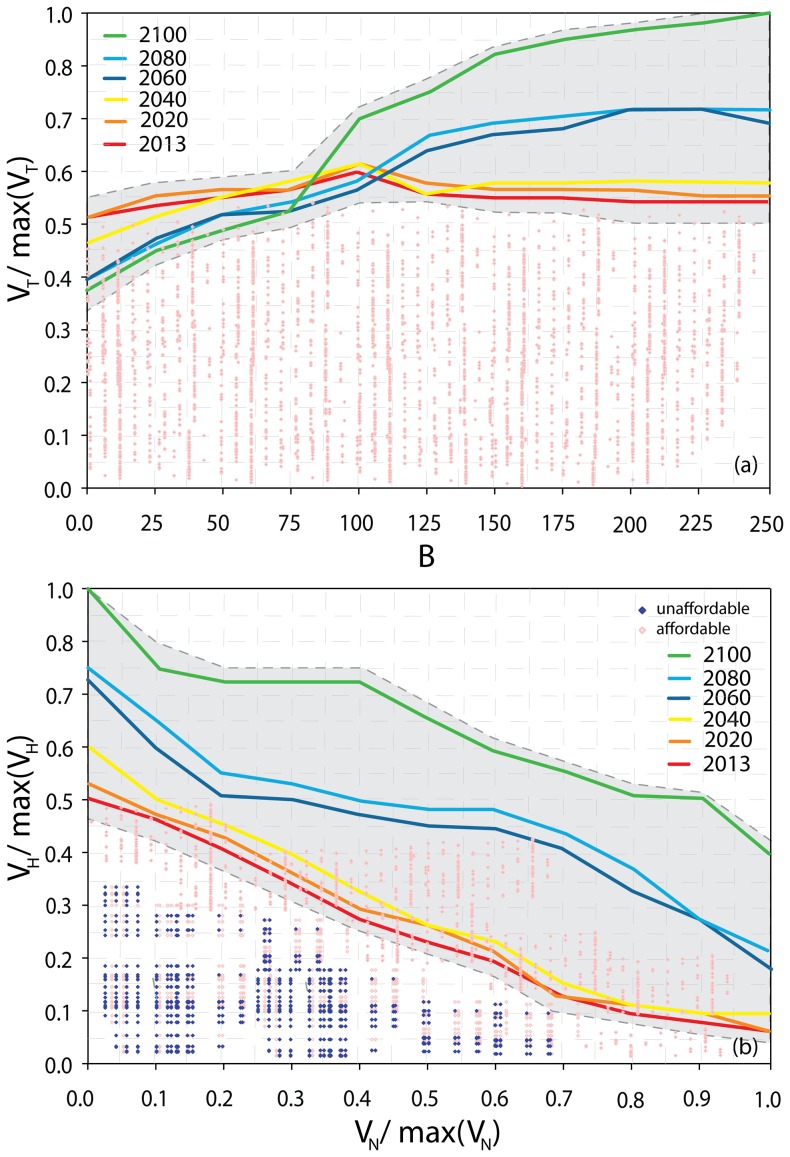
Figure 4. Pareto frontiers after realization of the selected restoration plan.
(a) Pareto optimization unconstrained to the available resources. Red points represent the suboptimal restoration plans for the frontier in 2013. Grey dashed lines represent the variability of the frontiers related to thirty Monte Carlo simulations generated considering a random white noise applied to the MCDA value. (b) Pareto frontiers constrained to the resources available for selected years of analysis; we assume that the total resources available are equal to 250 at the installation scale (Eglin AFB in Figure 1). The frontiers show VH and VN (Eq. 2) normalized to their maximum value. The blue and red dots represent unaffordable and affordable restoration plans (or portfolios) for 2100. All the possible values of VH(R) and VN(R) for selected years are shown along the Pareto frontiers. The choice of the Pareto set depends on relative stakeholder preferences for human and natural assets.

