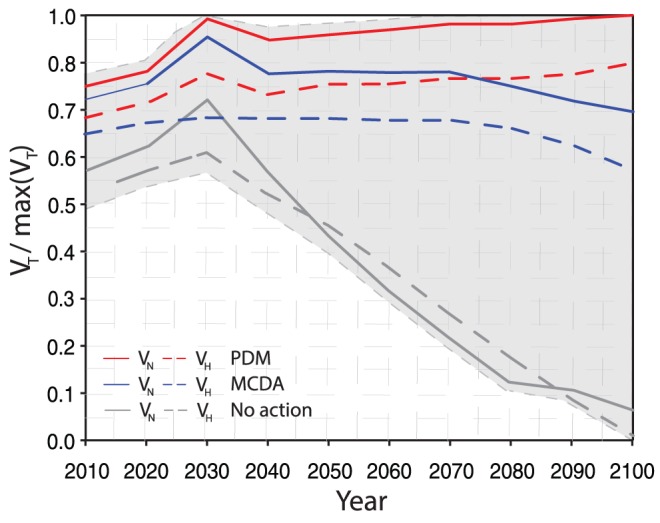
Figure 6. Global value disentangled into expected human and natural value of optimal restoration plans for the MCDA and PDM.

The expected natural and human values (Eq. 2) are calculated by considering the vulnerability of human and natural assets given a restoration plan for the whole ecosystem and the effectiveness of each restoration intervention for each asset. The curves are shown for a budget of 250 units. We selected the Pareto set for which VH(R) = 0.5 VN(R). Grey dashed lines represent the variability of the patterns related to thirty Monte Carlo simulations generated by considering a random white noise in the MCDA value.
