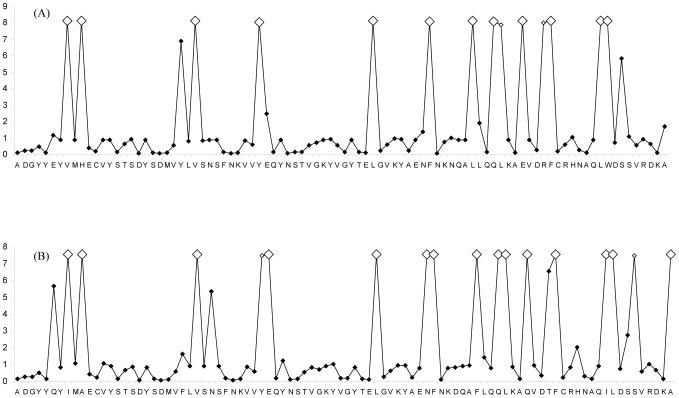
Figure 4. Approximate posterior means of ω under the M8 random sites model.
Approximate posterior means of ω calculated as the weighted average of ω over the 11 site classes and weighted by the posterior probabilities under the M8 random sites model are shown for DAB-like sequence variants for P. toxostoma (A) and for C. nasus (B). Sites inferred to be under positive selection at the 99% level are indicated by large white squares and those at the 95% level are indicated by small white squares. The reference sequences in the graphic presentation are the following: Pato-DAB3*01 for P. toxostoma and Chna-DAB3*02 for C. nasus.

