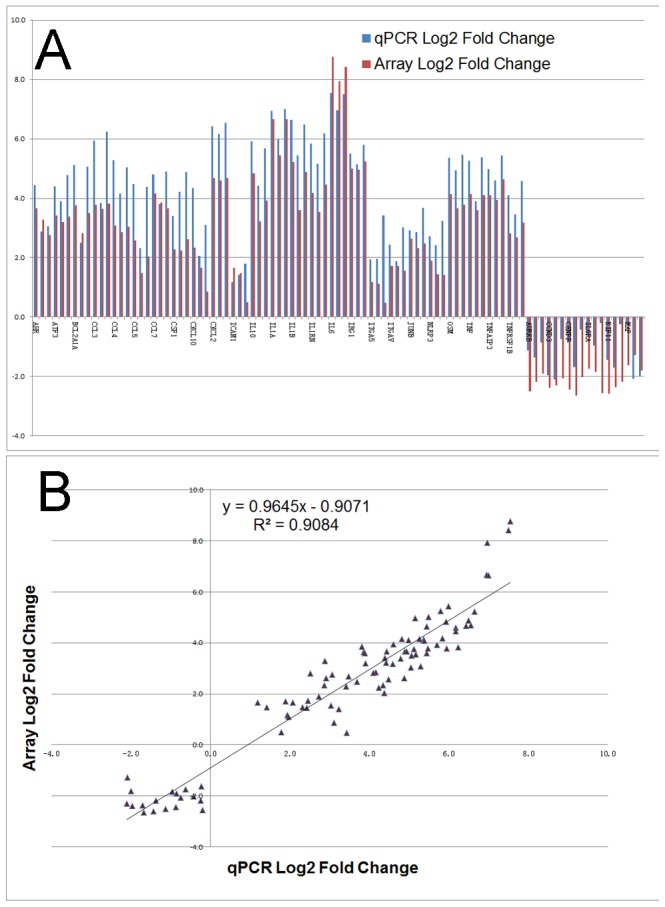
Figure 3. Validation of differential expression of a subset of genes by quantitative real-time PCR.

(A) RT-PCR confirmation of Affymetrix array data on 31 selected up- or down-regulated genes. Log2 Q-PCR fold-change data are represented by blue bars, whereas log2 values from microarray experiments are depicted as red bars. (B) Correlation analysis of the microarray and Q-PCR transcript measurements for the same 31 regulated genes. The microarray log2 values were plotted against the Q-PCR log2 data. The correlation coefficient (R2) between the two analyses is 0.91. For details on gene abbreviations and fold change compared with control, see Table S2.
