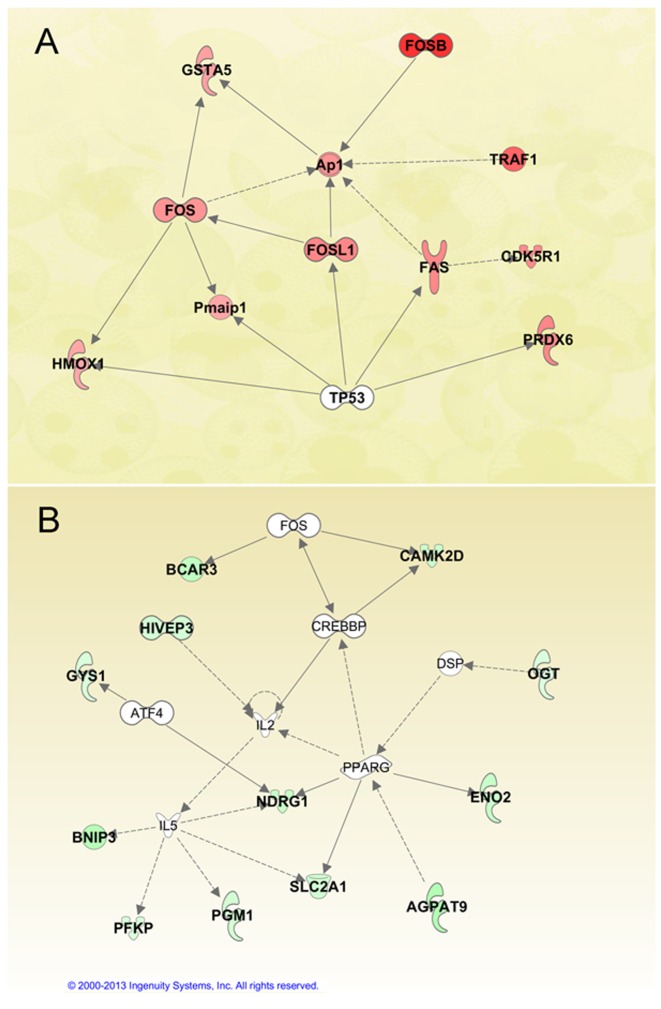
Figure 4. Pathogenic and non-pathogenic specific networks.
Ingenuity Pathway Analysis (IPA) identified two top-scoring networks from genes with a ≥2 fold increase in expression in both BCG and H37Ra compared with M.smeg (4A, genes assigned a red fill), as well as the inverse comparison of M.smeg to both BCG and H37Ra (4B, genes assigned a green fill). Solid interconnecting lines show the genes that are directly connected and the dotted lines signify an indirect connection between the genes, with gene functions attributed by shapes assigned by the IPA knowledge base. Genes with no color are network members that are not differentially expressed. For details on gene abbreviations and the magnitude of expression changes, see Table 1.

