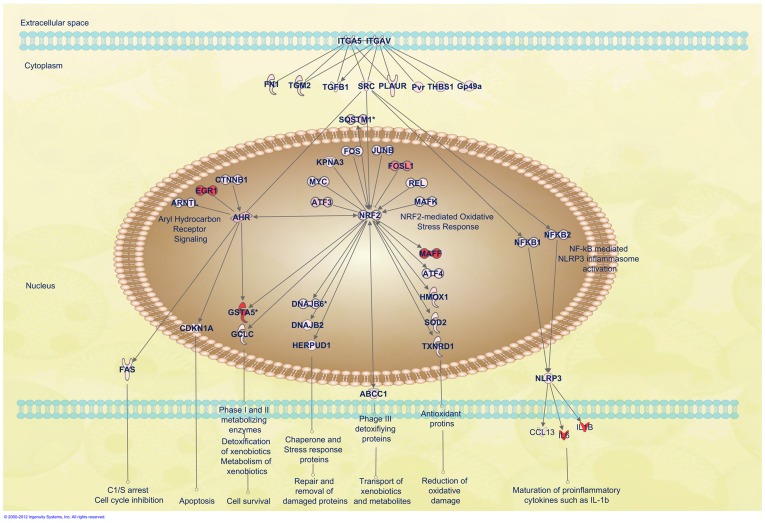
Figure 6. Diagram of integrin (ITGA5 and ITGAV) and SRC signaling pathways.
Shown are AhR signaling, the NRF2-mediated oxidative stress response, and the NLRP3 inflammasome activation pathway regulated by ITGA5/ITGAV and SRC axis. Up-regulated genes downstream of ITGA5/ITGAV and SRC were linked to these three identified signaling pathways with data only displayed from BCG infection. For details on gene abbreviations and fold changes compared with control, see Table S3. The network is graphically represented as nodes (gene products) and edges (the biological relationship between nodes). Red-shaded nodes represent up-regulated genes.

