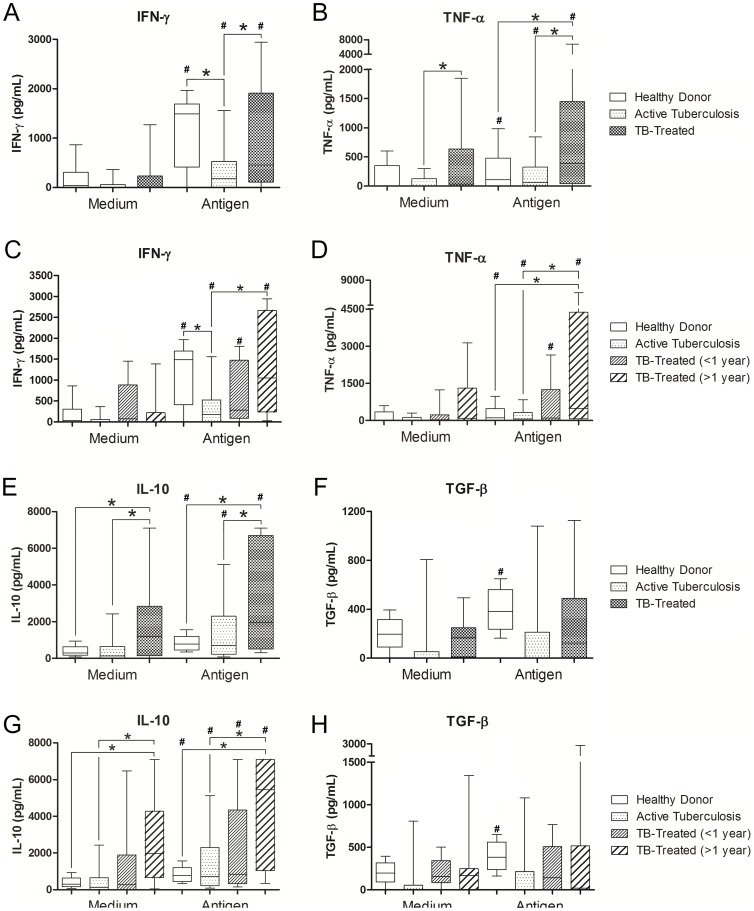
Figure 2. Th1 and T regulatory cytokines in active and clinical cured tuberculosis.
Production of IFN-γ, TNF-α, IL-10 and TGF-β by PBMCs from Healthy Donors, patients with active tuberculosis and clinically cured patients in unstimulated (medium only) and stimulated (4 µg/mL M. bovis antigen) cultures. A, B, E, F. Comparison between healthy donors, patients with active tuberculosis and clinically cured patients (TB-treated). *p<0.0167: Kruskal-Wallis test (followed by post-hoc Bonferroni/Dunn test for multiple comparisons). C, D, G, H. Comparison between Healthy Donors, patients with active tuberculosis and different times after clinical cure (TB-treated<1 year and TB-treated>1 year). *p<0.0083: Kruskal-Wallis test (followed by post-hoc Bonferroni/Dunn test for multiple comparisons). Horizontal lines represent the median, bars represent 25–75 percentiles, and vertical lines represent 10–90 percentiles. #p<0.05 in unstimulated versus stimulated cultures (4 µg/mL M. bovis antigen), Wilcoxon test.

