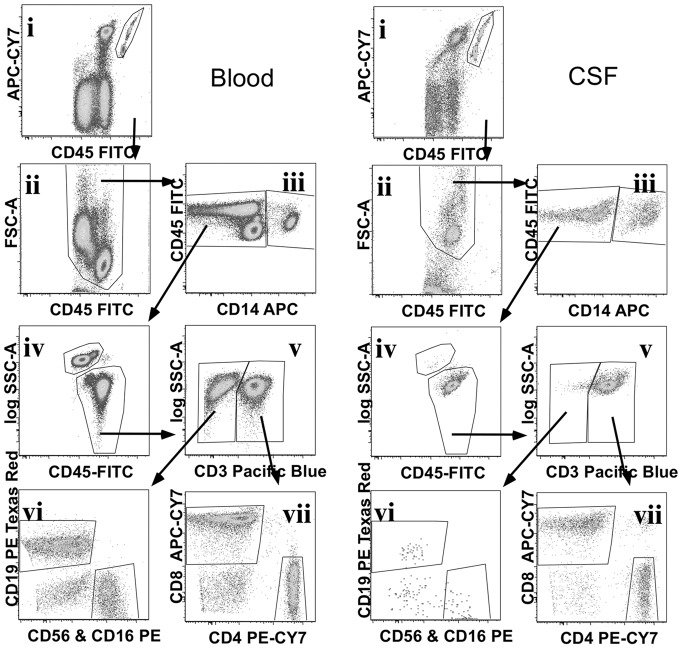
Figure 1. Flow cytometry gating strategy to define blood and CSF white blood cell (WBC) populations.
Data was compensated and gated using FlowJo to define TruCOUNT™ beads, (i) from both blood (left panel) and CSF (right panel) data. Remaining events were displayed in a CD45 vs FSC plot (ii) to gate out debris and define a total WBC population. CD14 was used to gate monocytes (iii) from the total WBC gate, and CD14− cells were displayed on a CD45 vs SSC plot (iv) to define lymphocyte and granulocyte gates. Lymphocytes were subdivided into CD3+ T cells and CD3− lymphocytes (v), CD3− lymphocytes were displayed on a CD19 vs CD56&16 (vi) plot to define B cells and NK cells respectively. CD3+ T cells were displayed on a CD4 vs CD8 plot (vii) to define CD4+ and CD8+ T cells.

