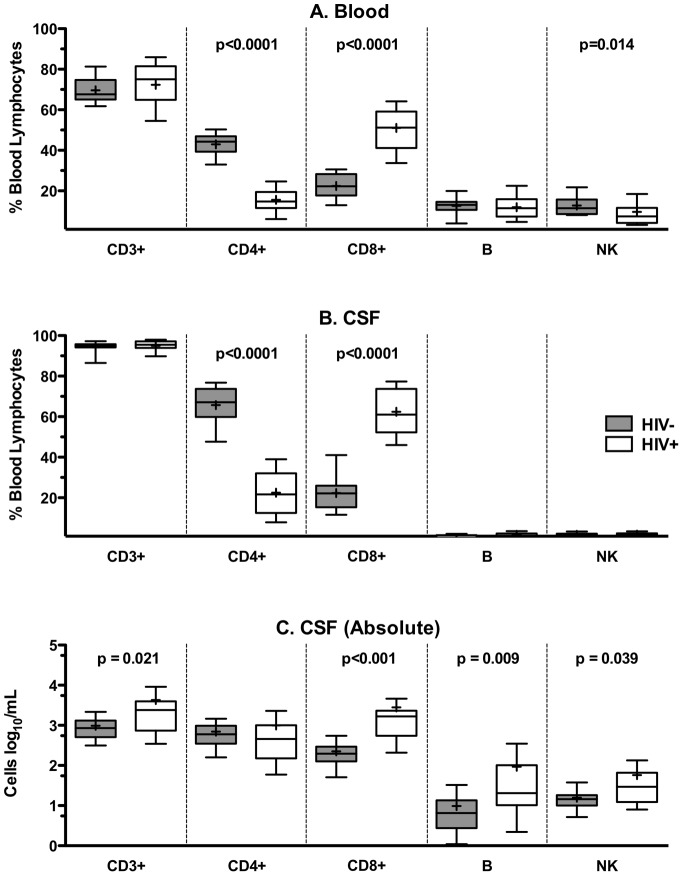
Figure 2. HIV-infected and uninfected subjects have distinct blood and CSF lymphocyte proportions and counts.
Proportions of CD3+, CD4+ and CD8+ T cells; B cells; and NK cells present in the blood (A) and CSF (B) of HIV-uninfected (HIV-) and HIV-infected (HIV+) subjects are depicted as a percentage of total lymphocyte population. Absolute CSF cell counts of lymphocyte subsets for HIV-uninfected and HIV infected (C) subjects are shown. Median and interquartile range for each cell population are shown in the box plots. Whiskers are set at 10–90%. Mean values are indicated by (+).

