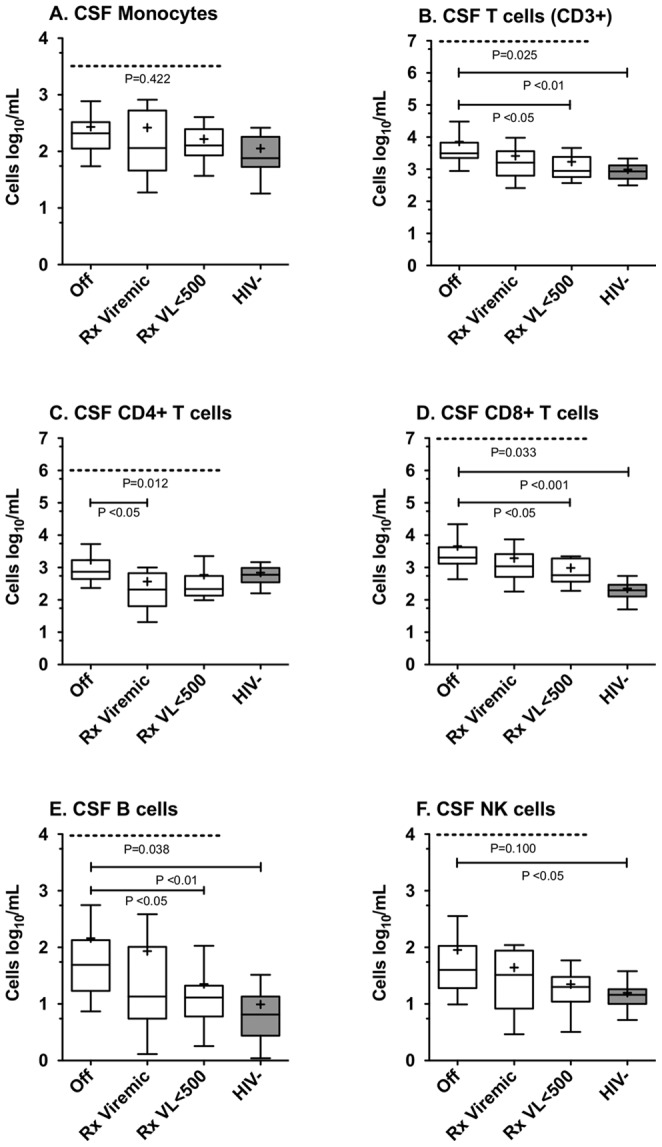
Figure 3. ART influences the absolute lymphocyte subset counts present in the CSF of HIV-infected subjects.

Absolute number of CSF monocytes (A), CD3+ T (B), CD4+ T (C), CD8+ T (D), B (E) and NK (F) cell subsets present in CSF of the 4 patient subgroups (Off, Rx Viremic, Rx VL<500 and HIV-uninfected) are shown. Median and interquartile range for each cell population are shown in the box plots. Whiskers are set at 10–90%. Mean values are indicated by (+). ANOVA for significant overall differences between the 3 HIV-infected treatment groups was conducted, with the p value depicted at the top of each panel. Post-hoc analysis using Dunn’s test comparing differences between pairs of groups, if statistically significant, are as indicated in each panel.
