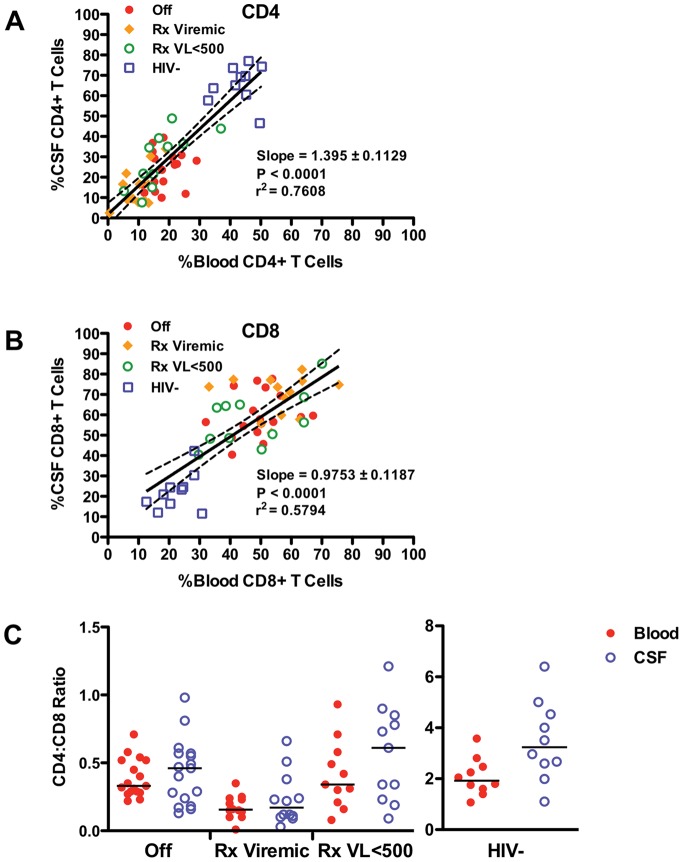
Figure 4. Comparison of T cell subsets in CSF and blood of HIV-infected and uninfected subject.
(A) Relation of CD4+ T cells present in the CSF to those present in the blood amongst the 4 subject groups with regression line (solid line; slope = 1.395, r2 0.7608, p<0.0001) and 95% confidence intervals (dotted lines). (B) Relation of CD8+ T cells present in the CSF to those present in the blood amongst the 4 subject groups with regression line (slope = 0.9768, r2 0.5794, p<0.0001) and 95% confidence intervals. (C) Comparison of CSF and blood CD4:CD8 ratio between the 4 subject groups.

