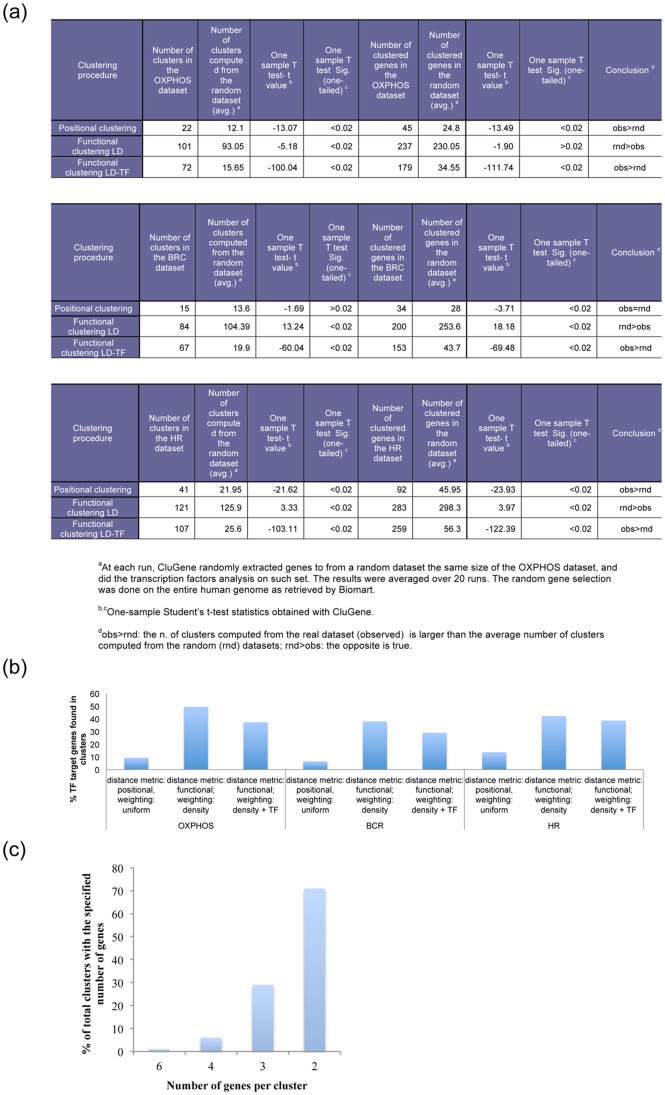
Figure 3. Different clustering behaviours of the DLBCL subsets subjected to sequential clustering and different distance metrics.
(a). The one sample t-test was used to validate the statistical significance of the number of clusters found in the test datasets, vs. number of clusters found in random datasets. (b). % target genes found in clusters with: simple positional distance metric, functional with local density and functional with local density and TF-similarity. (c) A histogram showing the frequency distribution of clusters is shown.

