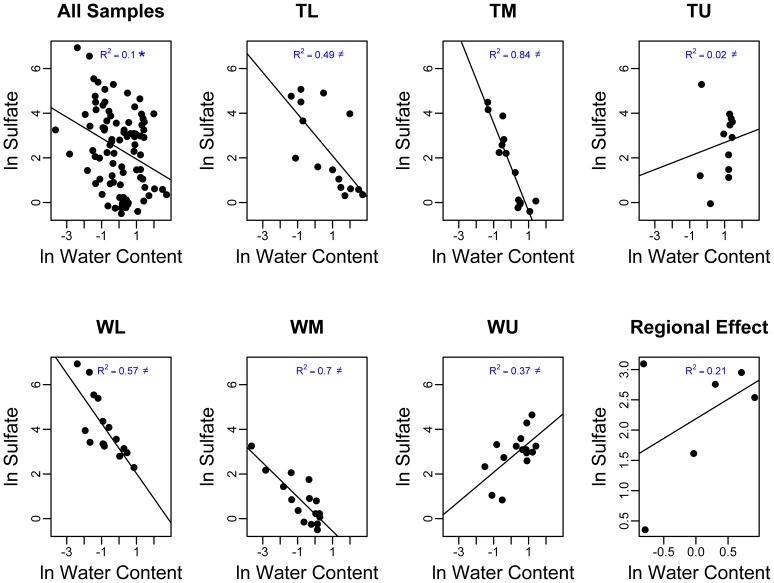
Figure 3. The ln of the water content (mg water g−1 dry soil) versus the ln of the sulfate values (ug sulfate g−1 dry soil) for all of the samples (pane 1), at the six sites (panes 2–7), and regional effects (pane 8).
Significant relationships have been noted for panes 1 and 8 (*) and a ≠ in panes 2–7 indicates that the within site relationships are statistically different across sites (i.e. a local contextual effect was found).

