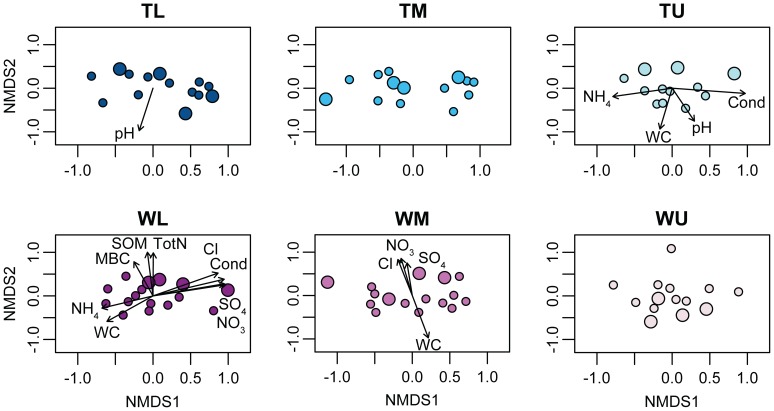
Figure 6. Nonmetric multidimensional scaling ordinations of the Bray-Curtis distance matrices created from the OTU (97% DNA identity) tables for each of the six sites with vector overlays of the significantly correlated normalized edaphic characteristics.
(Cl = chloride, Cond = electrical conductivity, MBC = microbial biomass carbon, TotN = total nitrogen, WC = water content, pH = soil pH, SO4 = sulfate, SOM = soil organic matter). The large circles represent control samples collected outside of the influence of the snow patches and the small circles represent snow patch associated samples.

