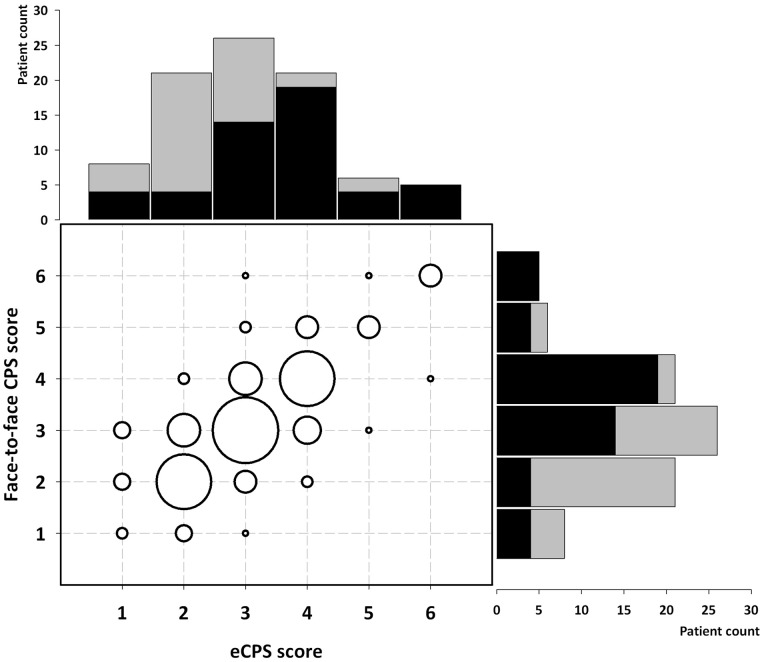
Figure 2. Distribution of role preferences according to administered CPS (face-to-face vs. electronic, eCPS) in 87 MS patients.
CPS scores range from 1 (active-active) through 6 (passive-passive). The histograms report numbers of patients with each CPS score, by country (Italy, black; Germany, grey). The bubble plot shows pairs of counts of each score, with larger bubbles corresponding to higher counts.

